At-a-glance chart shows both detection rates and impact on system performance.
The results of the
latest VB100
comparative review were released recently, covering 40 products on
Windows XP
– possibly our last visit to the platform, given its apparently fast-approaching end-of-life. As usual, it was a pretty epic undertaking for our small team, with all manner of weird and wonderful problems to overcome. The report itself is as comprehensive and detailed as ever, but we’ve also included a new chart to try to give a more immediate overview of how well products performed.
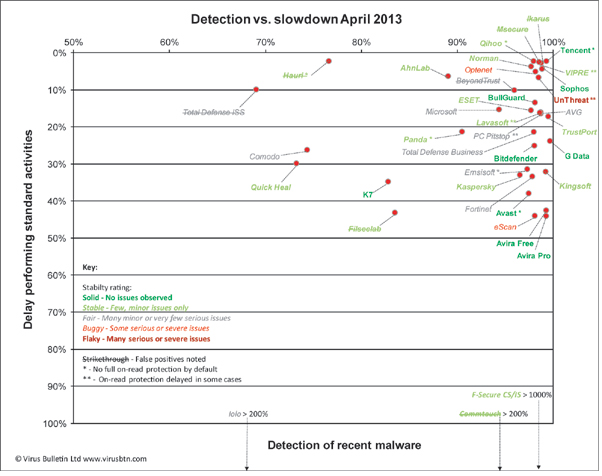
(Click
here
for a larger version.)
The chart ranks products by detection, as recorded in our ‘Response’ tests, against the slowdown observed performing a standardised set of everyday tasks. It also includes colour-coding to indicate our ‘Stability’ rating, and flags up which products were hit by false positives in the tests.
The Response test measures scanning detection over seven sample sets gathered in each of the seven days prior to running the test. Unlike our RAP test, products use the latest available updates and are given full access to the Internet for any cloud lookup system which may be in operation, so the results give our best general guide to basic on-demand detection rates.
The activities test takes a set of standard, clean sample files in a range of common formats (mostly media and document types as these are the sort of files most often manipulated on an everyday basis). They are fetched from a local webserver, and subjected to an automated series of standard actions – copying, pasting, moving, zipping and unzipping, and so on. The time taken to complete this set of actions is measured with and without products in place, the difference between the two being the extra time lag imposed by the products. It can thus be considered our best measure of general system slowdown.
By comparing these two metrics, we can easily tell which products are slowing systems down, and which ones are underperfoming in detection. To this we have added our stability rating scheme, which rates products according to how many bugs, errors and crashes were observed during the test period, and how severe those issues were considered to be. A points system is used to separate products into one of five stability rating levels. The ratings range from dark green for ‘Solid’, or no issues at all, to dark red for ‘Flaky’ products with many serious problems.
Finally, we’ve also marked out products which false alarmed in our clean sets (and were thus also denied VB100 certification), and products which have non-standard approaches to on-access or ‘real-time’ protection, which might give them an advantage in the speed measures.
There were a few anomalies noted in this month’s tests, with some products throwing out some very odd scores. We’ll continue to hone both the tests and the way in which the results are displayed, and look forward to seeing how this new chart looks next time, when we will be testing both on new hardware and a new platform. We hope our readers will find it a useful addition to our reports.
VB subscribers can read the full report
here
, and it is available for non-subscribers to purchase as a standalone article ($19.95)
here
.
Posted on 01 May 2013 by
John Hawes
Leave a Reply