In this special guest blog post, VB2017 Silver sponsor Cisco Umbrella writes about a paper that researchers Dhia Mahjoub and David Rodriguez will present at the conference this Friday.
In the past decade, detection of DGA (Domain Generation Algorithm) domains has relied primarily on lexical analysis of domain names, tracking of NX (non-resolving) domains, and malware reversing. The earliest works have been groundbreaking but since then, we have only observed small incremental improvements, combining machine learning techniques with sandbox-based analysis of DGA malware.
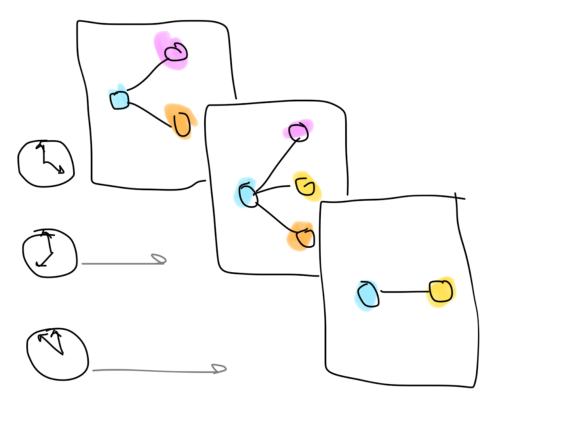
Figure 1: Time-dependent user-domain interactions.
In a
talk
to be given by
Cisco Umbrella
researchers Dhia Mahjoub and David Rodrigeuz at VB2017 this Friday, we propose to completely reframe the problem and take advantage of a worldwide visibility into user-domain interactions via DNS. We introduce a novel approach to not only represent client-domain interactions as a bipartite graph but also carefully study the evolution of the topological properties of this graph over time, hence the concept of ‘time series on graphs’.
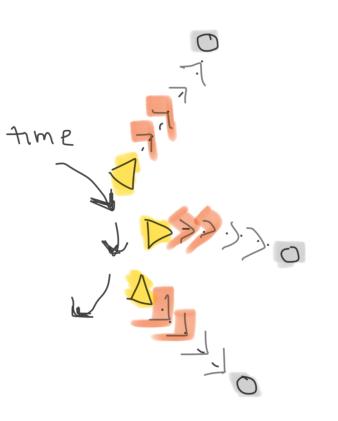
Figure 2: A client (a yellow triangle) querying domains (grey circles) at different rates at different times.
We unravel these time-dependent graphs by tracking bots surfing the Internet. What we mean by ‘bot’, is a client machine infected with malware, controlled by some other machine(s). We then study how these machines query domains on the Internet. Reciprocally, we study domains receiving queries from bots. And here’s the breakthrough: the sender of queries and the receiver of queries appear to be symmetrical and loaded with action.
Stepping back, it becomes clear that a bot is not only defined by the speed at which it queries domains, but also by the diversity of domains, repetition, and popularity of those domains. Similarly, algorithmically generated domains typically deployed in botnets, are not only defined by the speed at which they are queried by clients, but also by the diversity of clients, repetition, and chattiness of those clients.
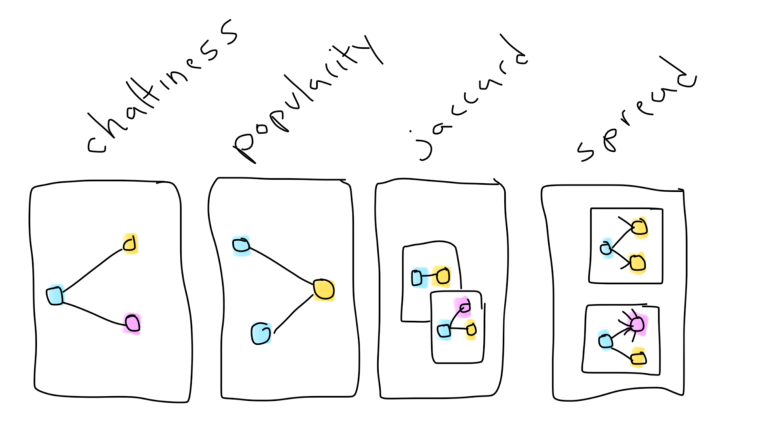
Figure 3: Graphical properties serving as building blocks to signals.
From a machine to domain edge, in the graphs we analyse are values indicating the force with which a machine is attracted to a domain, or a domain is attracted to a client. This interaction is one of millions that occur hourly, creating one very noisy graph. As we observe this graph over time, we see the values fluctuate with differing velocity. The beauty is to see these sender/receiver signals isolate domains used in a broad variety of campaigns: Necurs, Conficker, Suppobox, PykSpa, and more.
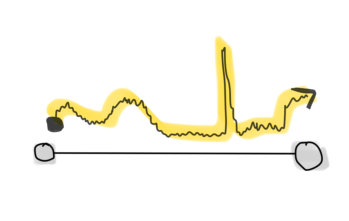
Figure 4: Interactions of one node in a graph with another, with edge weights varying over time.
Using Hadoop technologies, we derive methods for creating and storing these signals computed on graphs, mapping the interactions of tens of millions of user-domains. In our talk, we will explain how we broke this problem down into smaller sub-problems that could be solved with effective MapReduce jobs woven in Oozie workflows, and why we chose not to use Spark and GraphX but to build our own graph and graph metric techniques.
Come to our
talk
to learn about these new methods to analyse and define a few intuitive and yet effective features on the nodes of any bipartite graph, but with a network security twist:
- Chattiness of a user IP (or the number of unique domains this user queried over a period of time)
- Popularity of a domain (or the number of unique user IPs that queried this domain over a period of time)
- Jaccard similarity for a user IP (or the percentage of similar domains this user IP queries from one hour to the next)
- Jaccard similarity for a domain (or the percentage of similar user IPs that queried this domain from one hour to the next)
- Spread (or the ratio between the average and median Jaccard similarity for a user IP or a domain).
‘Beyond lexical and PDNS: using signals on graphs to uncover online threats at scale’ will be presented by Dhia Mahjoub and David Rodriguez at 14:00 on Friday 6 October in the Red room.

Leave a Reply